Similarity Diagrams
Info
Requires a gold standard.
Info
Your matching solution must output a similarity score next to the matching decision.
The Similarity Diagrams analysis allows you to find the best similarity threshold.
Getting Started
- Add the benchmark datasets to Snowman
- Add gold standards for the datasets to Snowman
- Add the experiments you want to investigate to Snowman
- Make sure that the experiment files you select contain a column for every similarity score you want to investigate.
- Some matching solutions like Magellan automatically export similarity scores. If Snowman supports the experiment format, the similarity scores will automatically be detected.
- Open the Benchmark Dashboard and select the analysis Similarity Diagrams.
- Select the datasets, gold standards and experiments in the configurator
- Select a similarity score to be investigated for every experiment
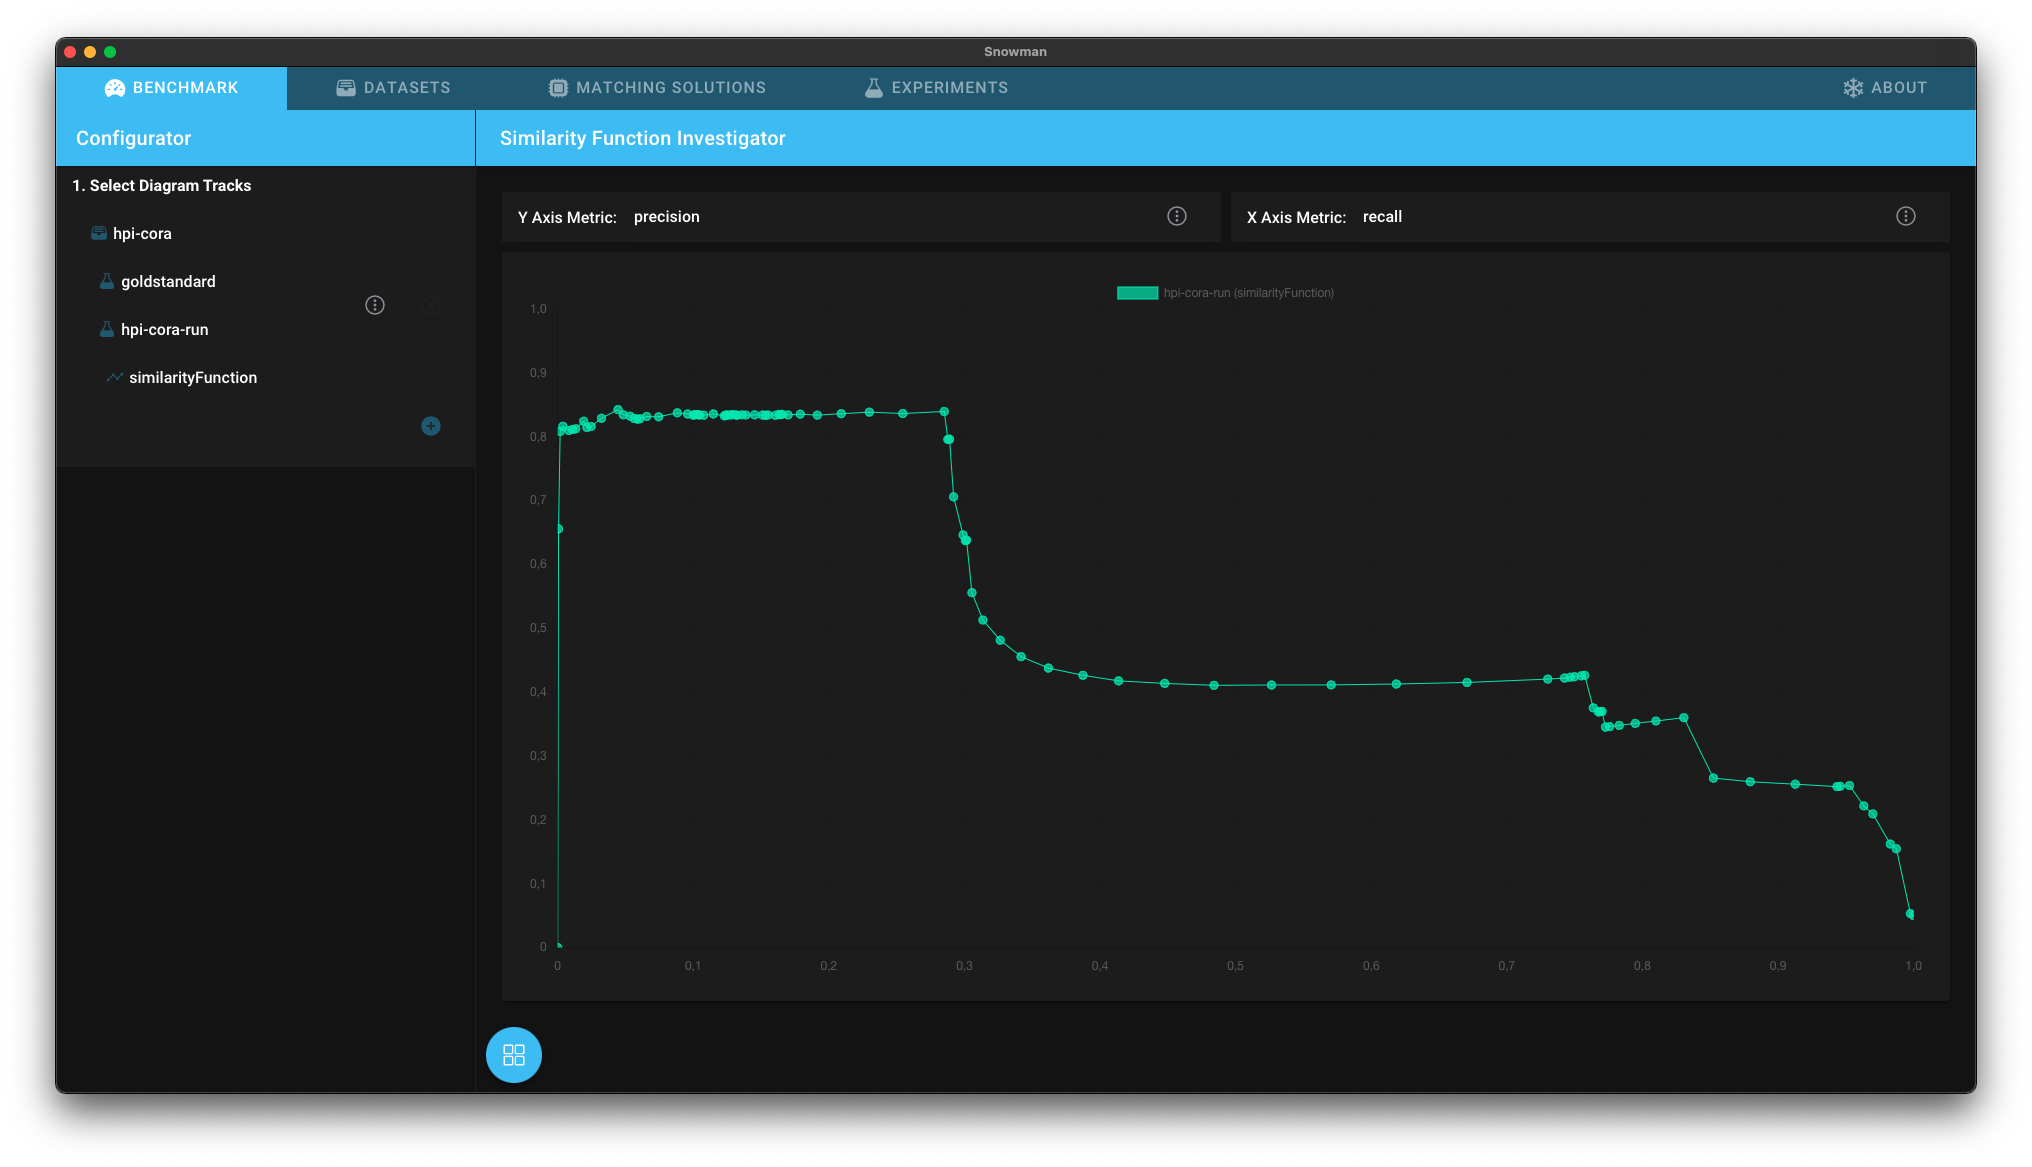
Interpreting the Results
This analysis allows you to see how metrics, such as precision or recall, evolve with different similarity thresholds. Therefore, it helps you to find the best threshold for your use case.
You can hover over points in the diagram to show the similarity threshold they correspond to. The metrics on the x axis and y axis can be changed with the dropdowns at the top of the page.