KPI Investigator
The KPI Investigator allows you to contrast accross matching solutions metrics, such as precision, with soft kpis, such as configuration effort.
Getting Started
- Add all matching solutions you want to compare to Snowman
- Add at least one experiment for every matching solution and enter the metrics you want to compare
- add more experiments to improve the evaluation quality
- Open the Benchmark Dashboard and select the analysis KPI Investigator.
- Select your experiments in the configurator
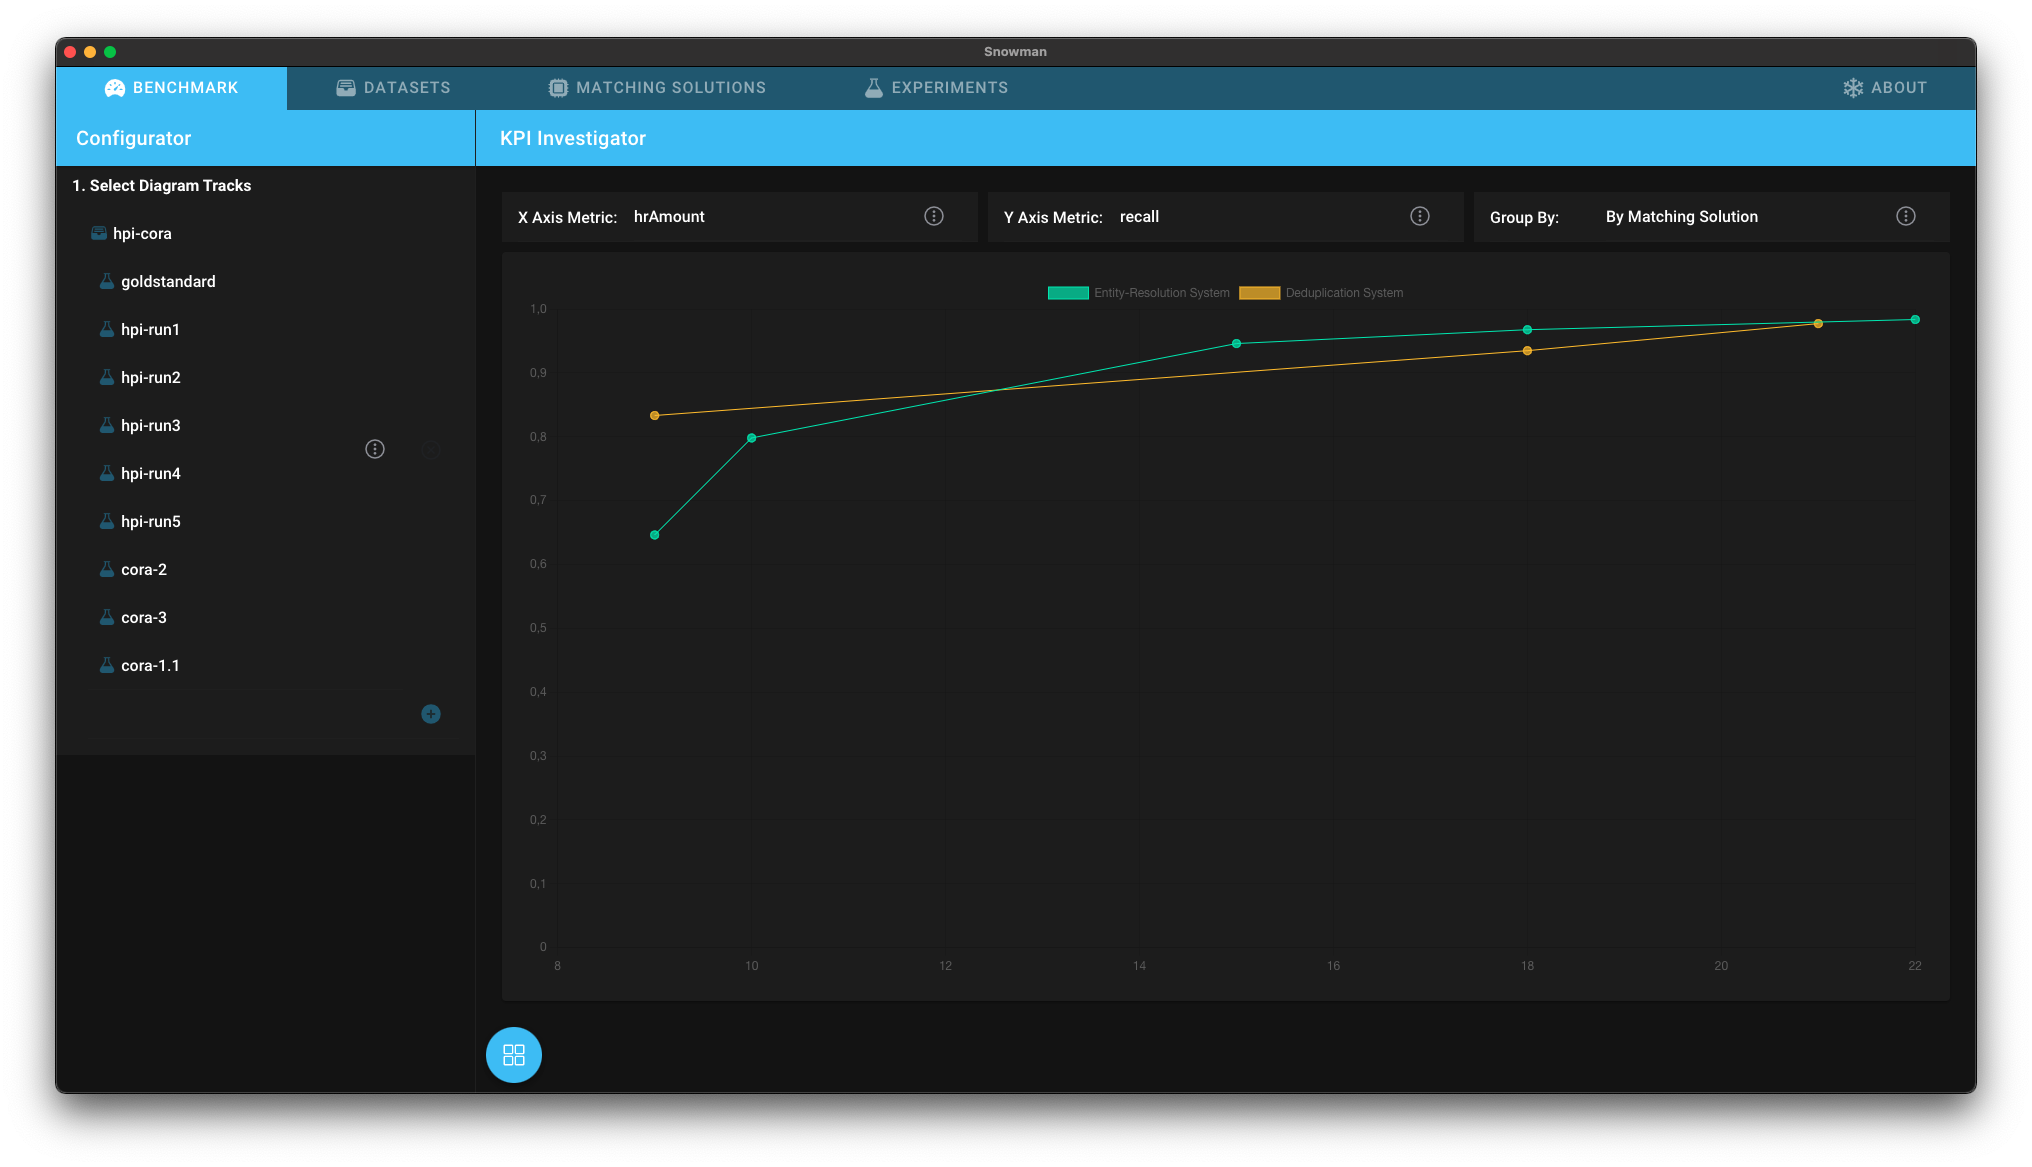
- You can select the metrics you want to compare from the dropdowns X Axis Metric and Y Axis Metric at the top of the page.
- Optionally choose whether to group (and color) the result by matching solution or dataset with the rightmost dropdown.
Interpreting the Results
In the screenshot above, the x-axis shows the needed hr amount (in person hours) to install a matching solution. The y-axis shows the recall of specific experiments. If your specific use case requires a recall of 85% or higher, Mock Solution might be better for you as it reaches this precision earlier. If your goal is to achive the highest possible performance without looking at the effort to get there, Magellan might be better as it overtakes Mock Solution after 20 hours of configuration.
Many other evaluations are possible. You can for example measure the difficulity of a dataset by adding experiments of different matching solutions for multiple datasets, grouping by dataset, and then viewing two performance metrics like precision/recall.