N-Metrics Table
Info
Requires a gold standard.
The N-Metrics Table allows you to compare performance metrics of multiple experiments.
Getting Started
- Add the benchmark dataset to Snowman
- Add a gold standard for the dataset to Snowman
- Add the experiments you want to investigate to Snowman
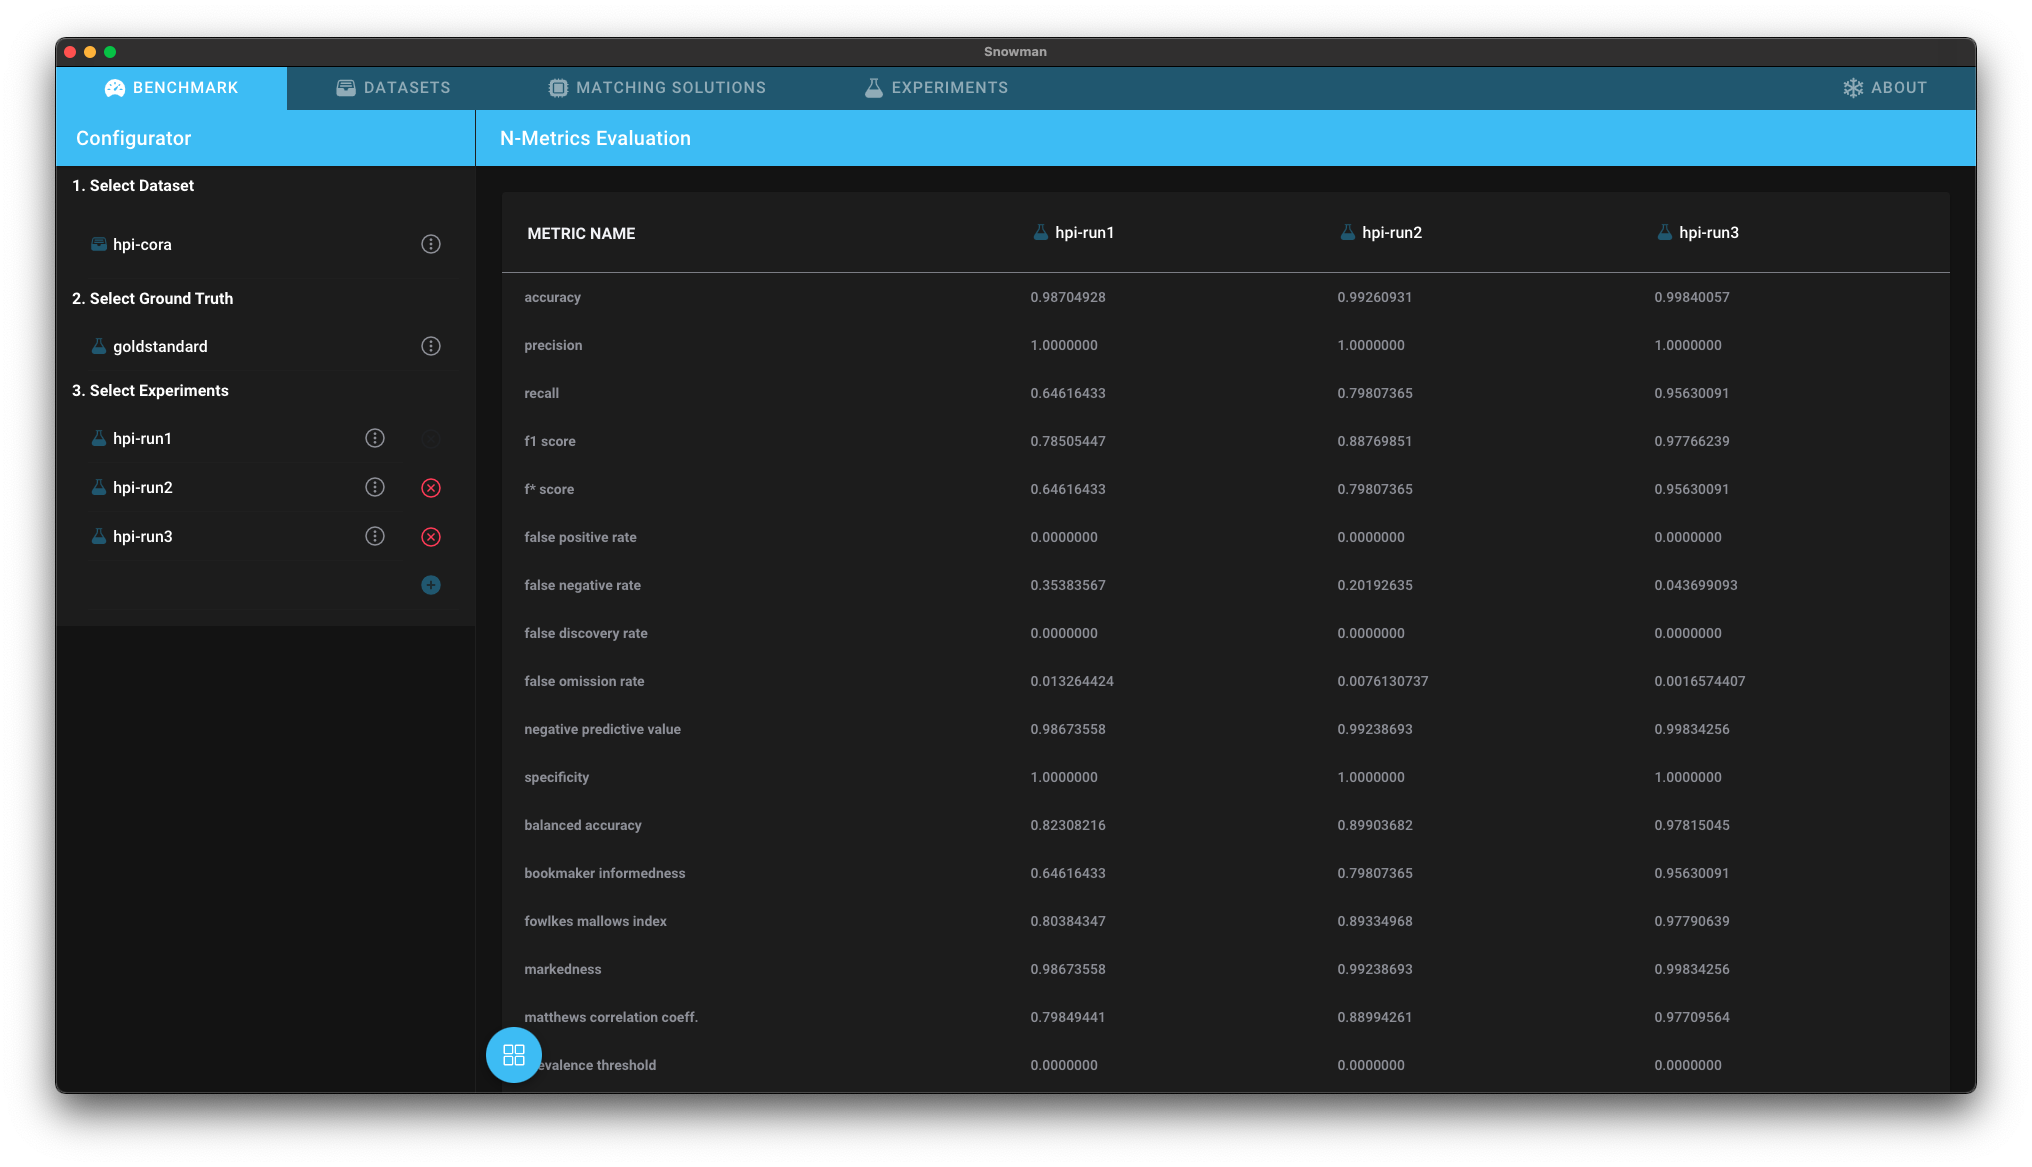
- Open the Benchmark Dashboard and select the analysis N-Metrics Table.
- Select the dataset, the gold standard and your experiments in the configurator
Interpreting the Results
Whenever you want to compare multiple experiments against a single ground truth, you can make use of the N-Metrics Table. It extends the Binary Metrics View across multiple experiments and presents the result in a table format.
Clicking on an experiment in the header opens the Binary Metrics View for this experiment. Hover over a metric or a value to see more information.