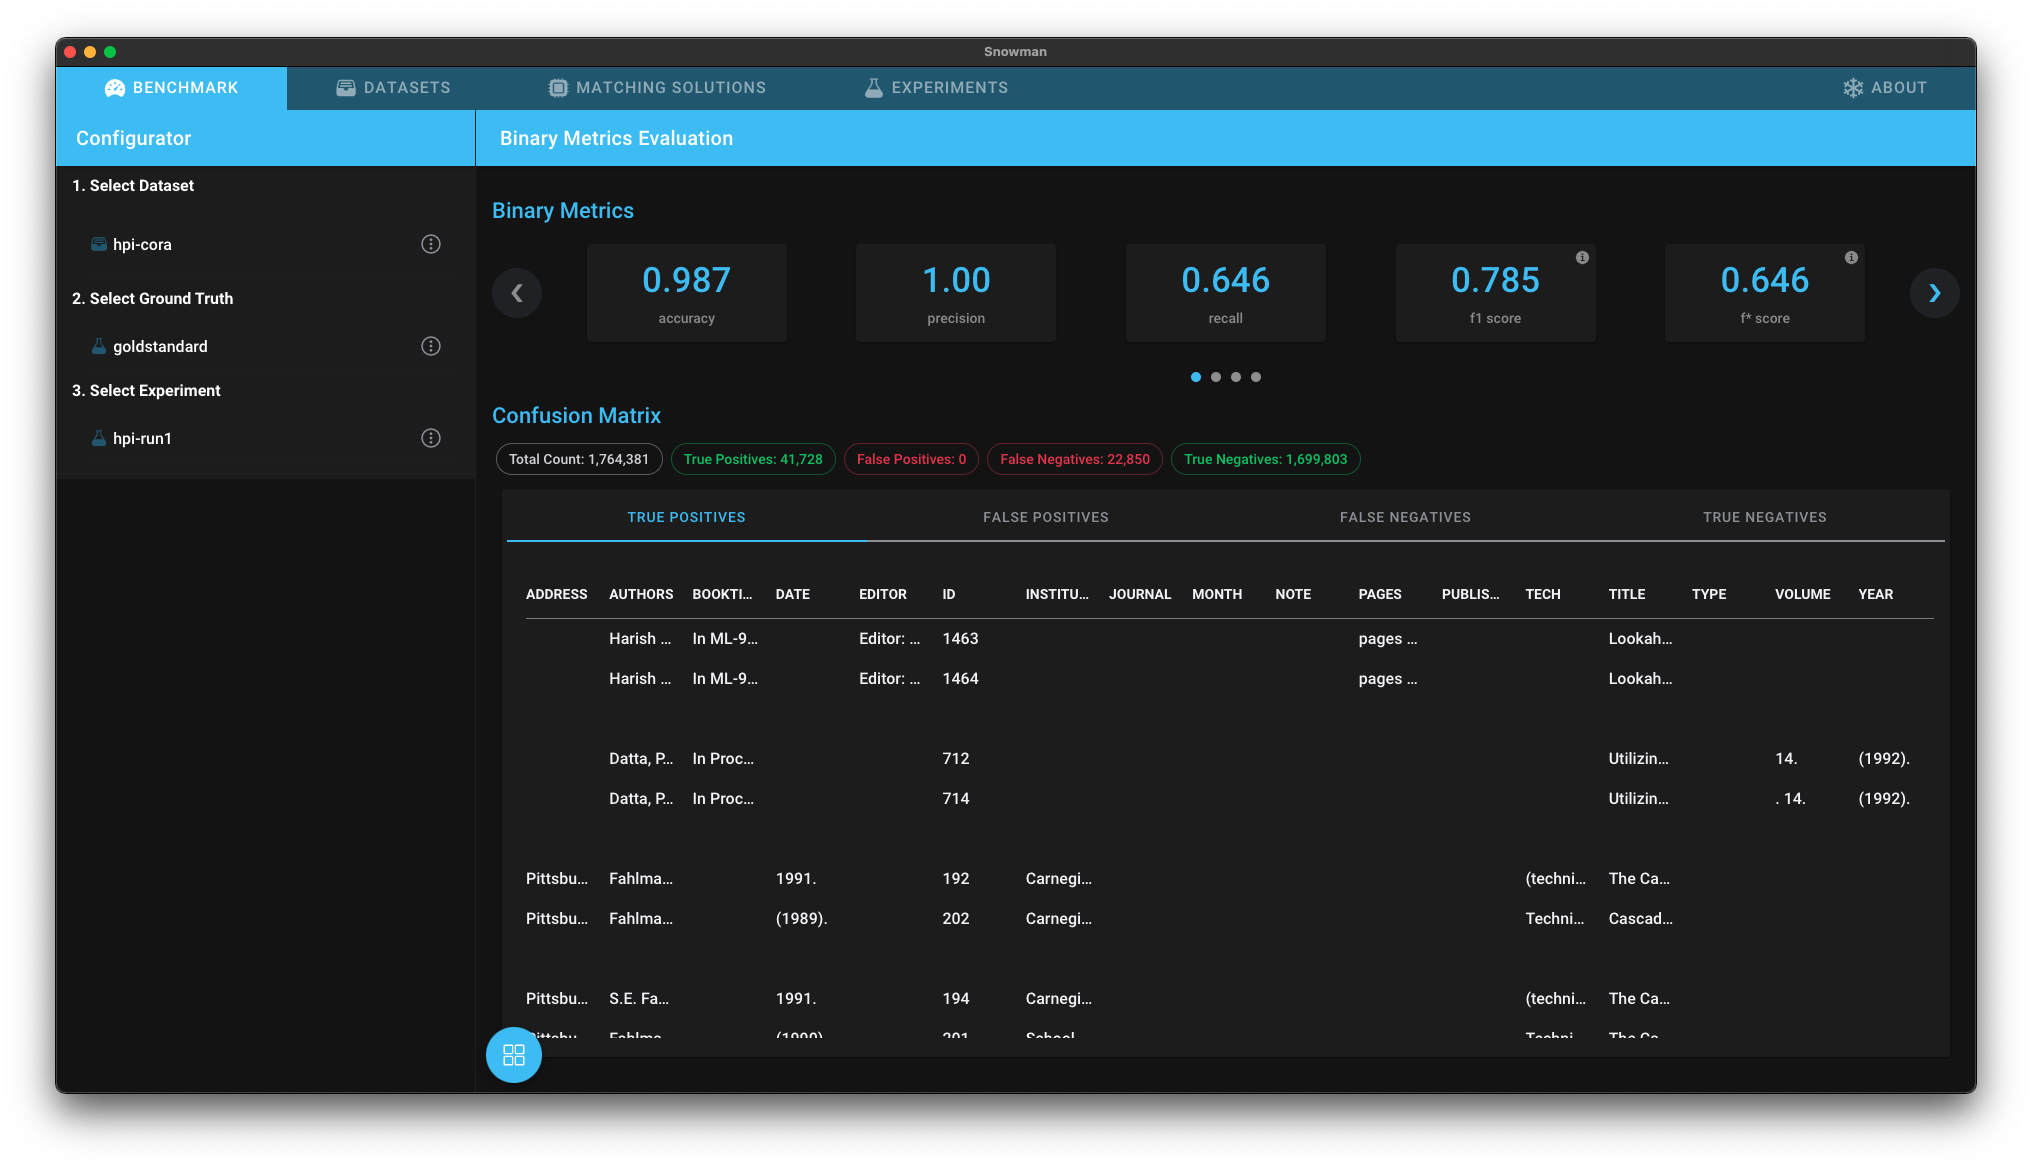
| Binary Metrics View |
The Binary Metrics View allows you to explore how good an experiment performed by showing it's predictions and performance metrics. |
 |
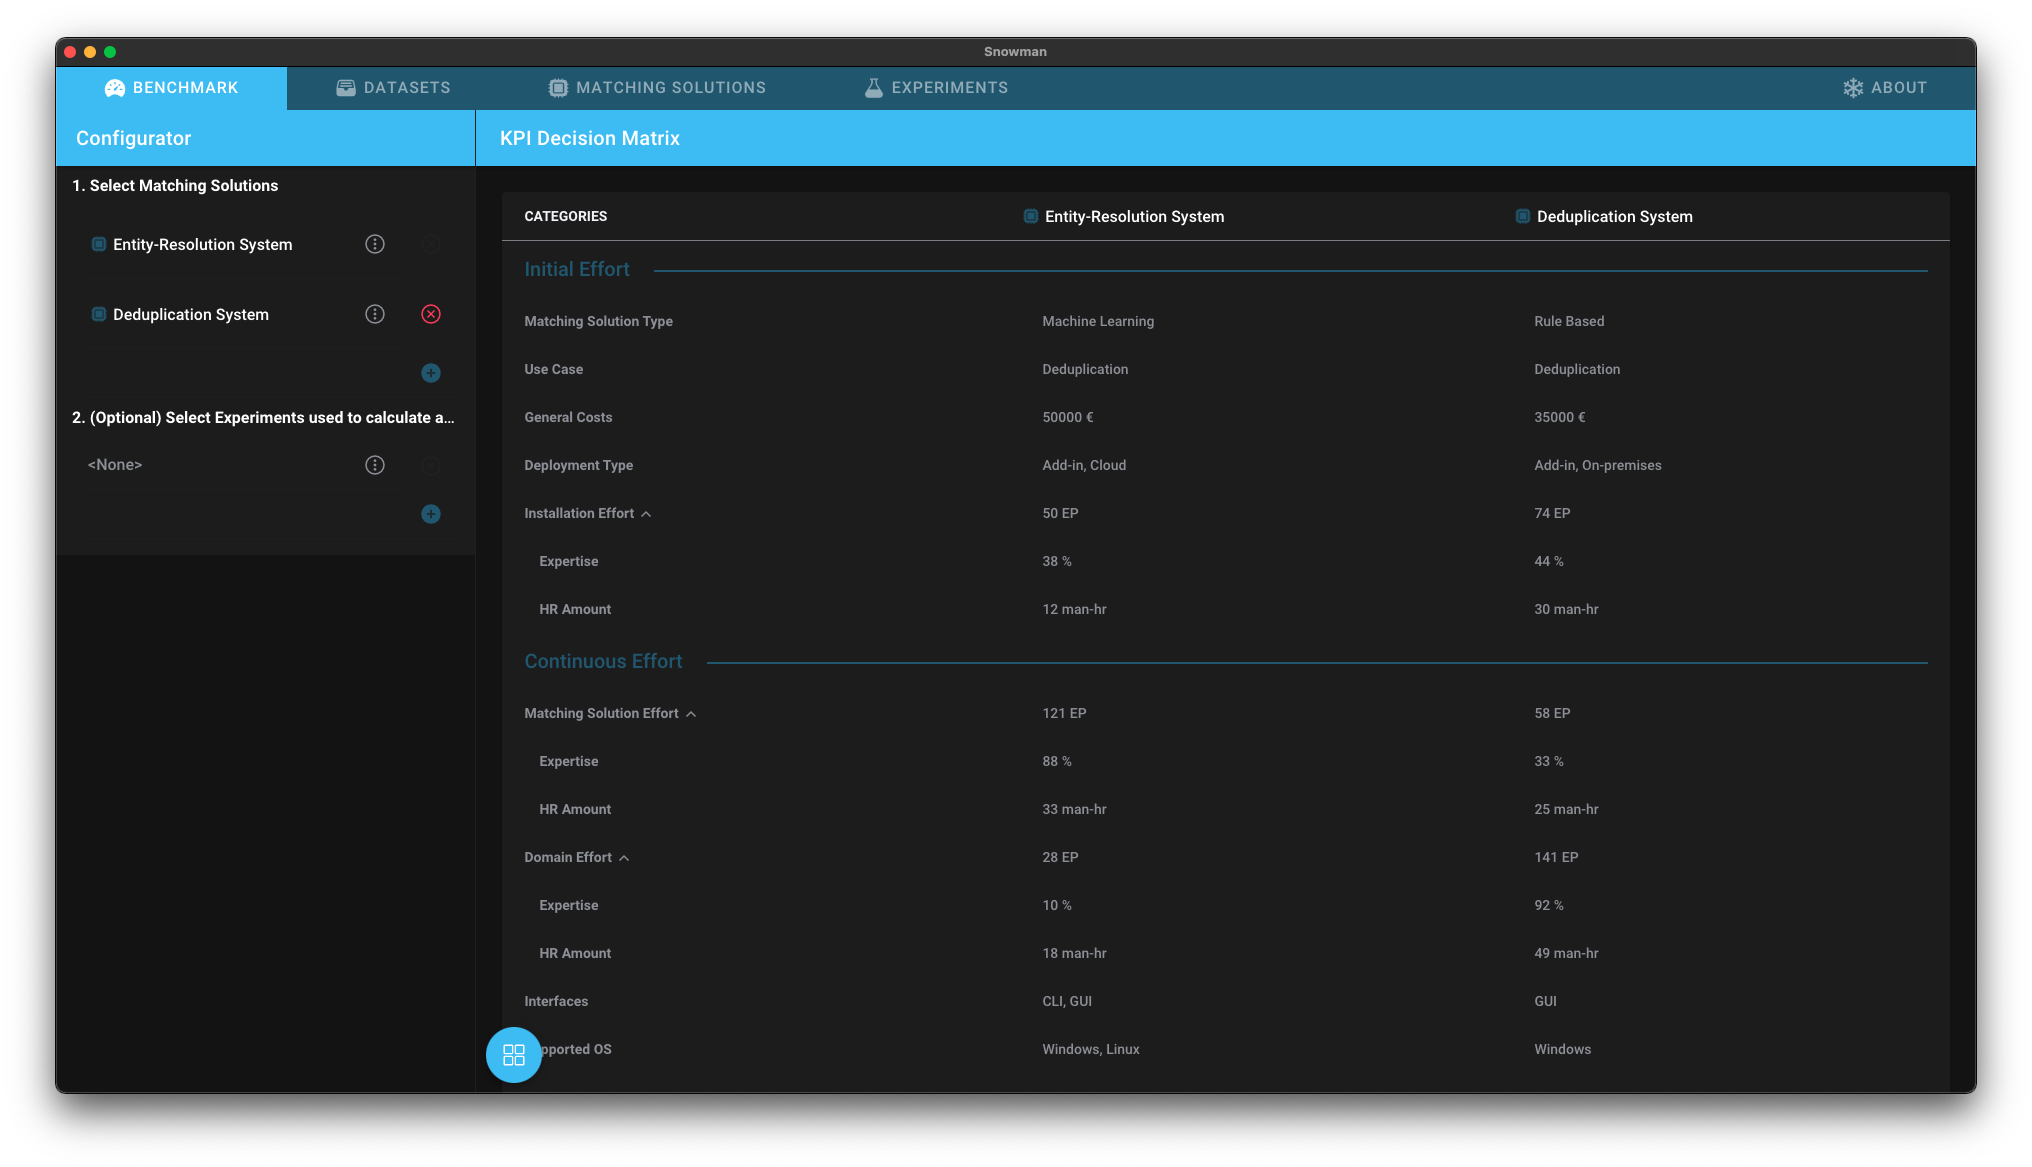
| KPI Decision Matrix |
The KPI Decision Matrix provides you with the most important kpis to make an informed buying decision. |
 |
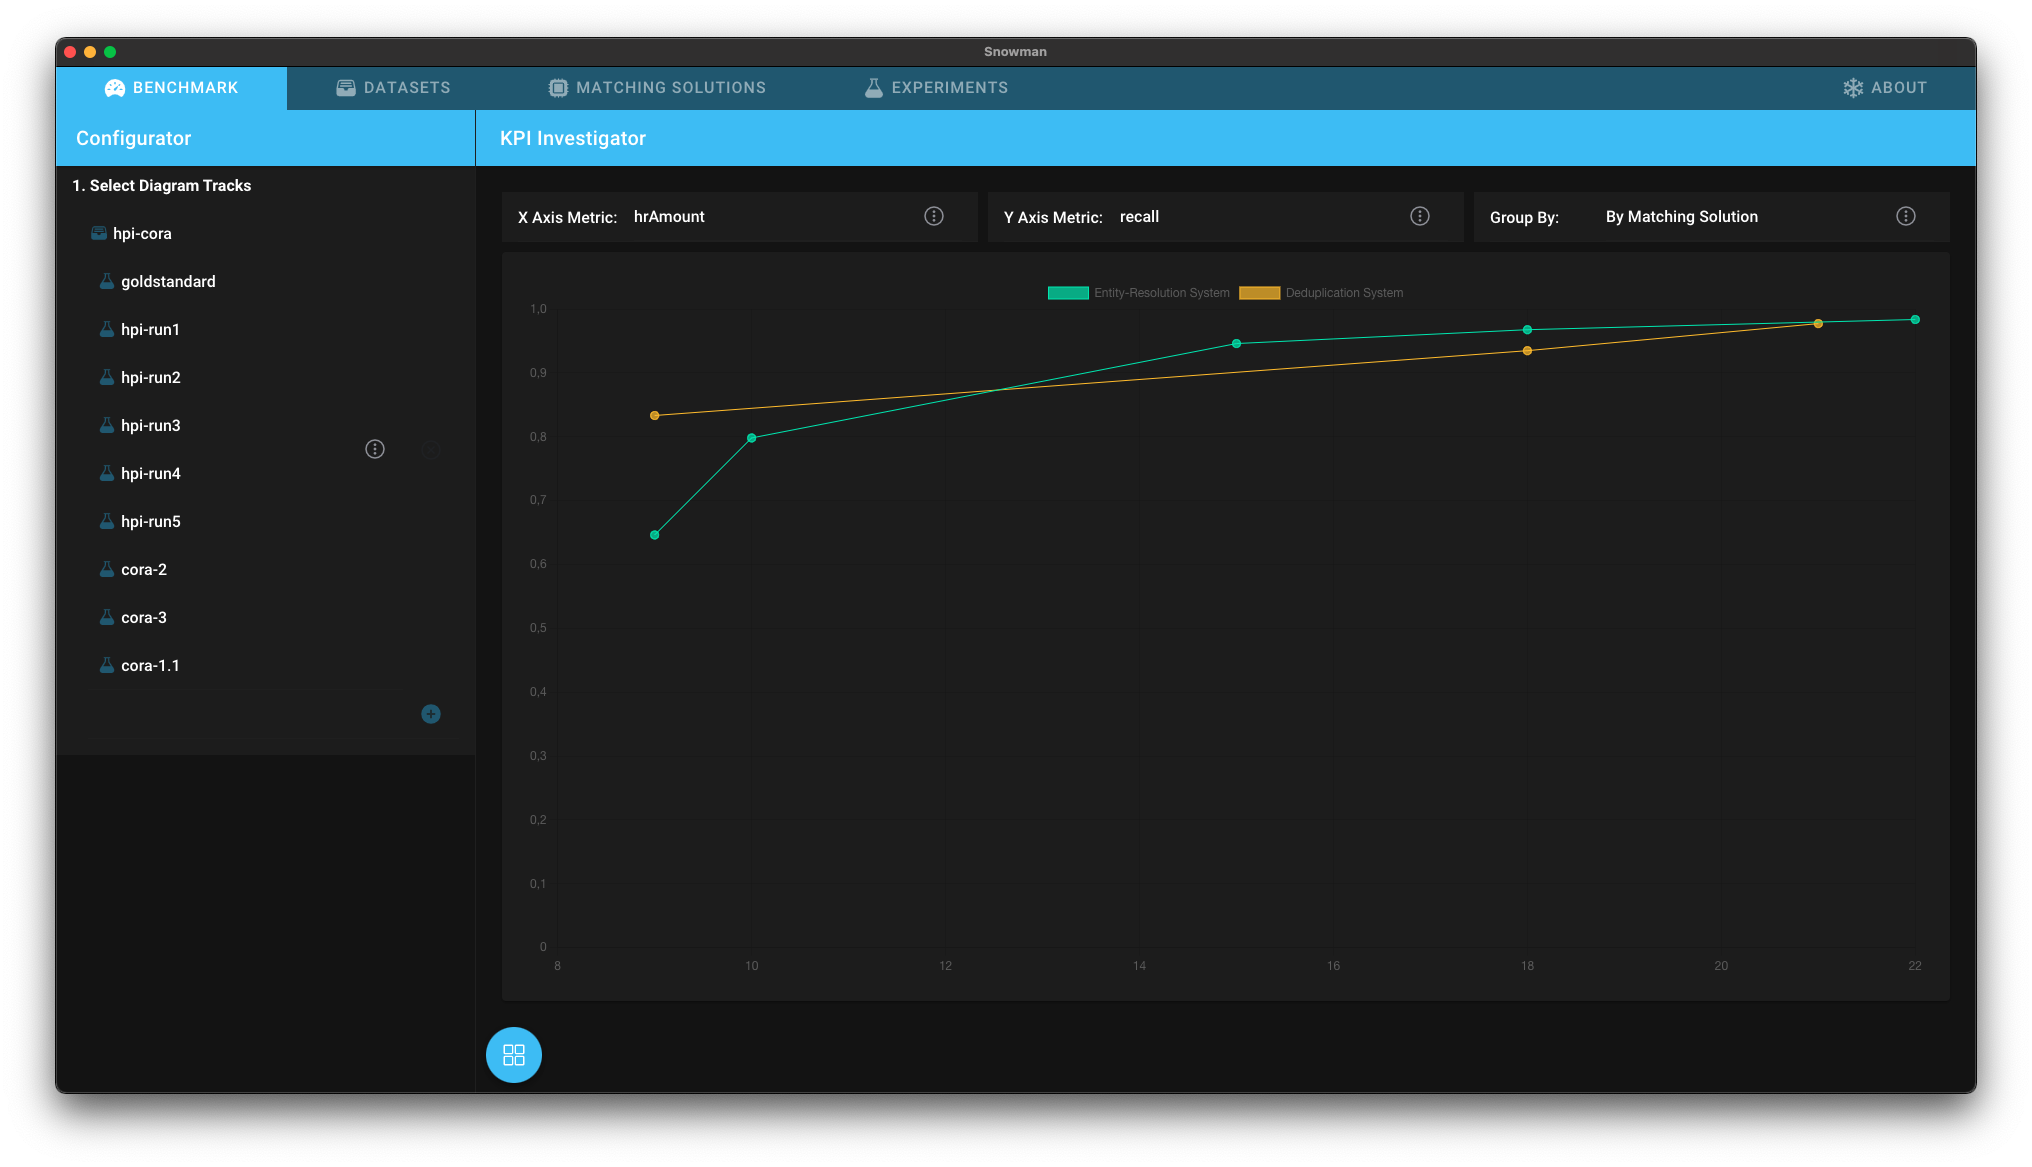
| KPI Investigator |
The KPI Investigator allows you to contrast accross matching solutions metrics, such as precision, with soft kpis, such as configuration effort. |
 |
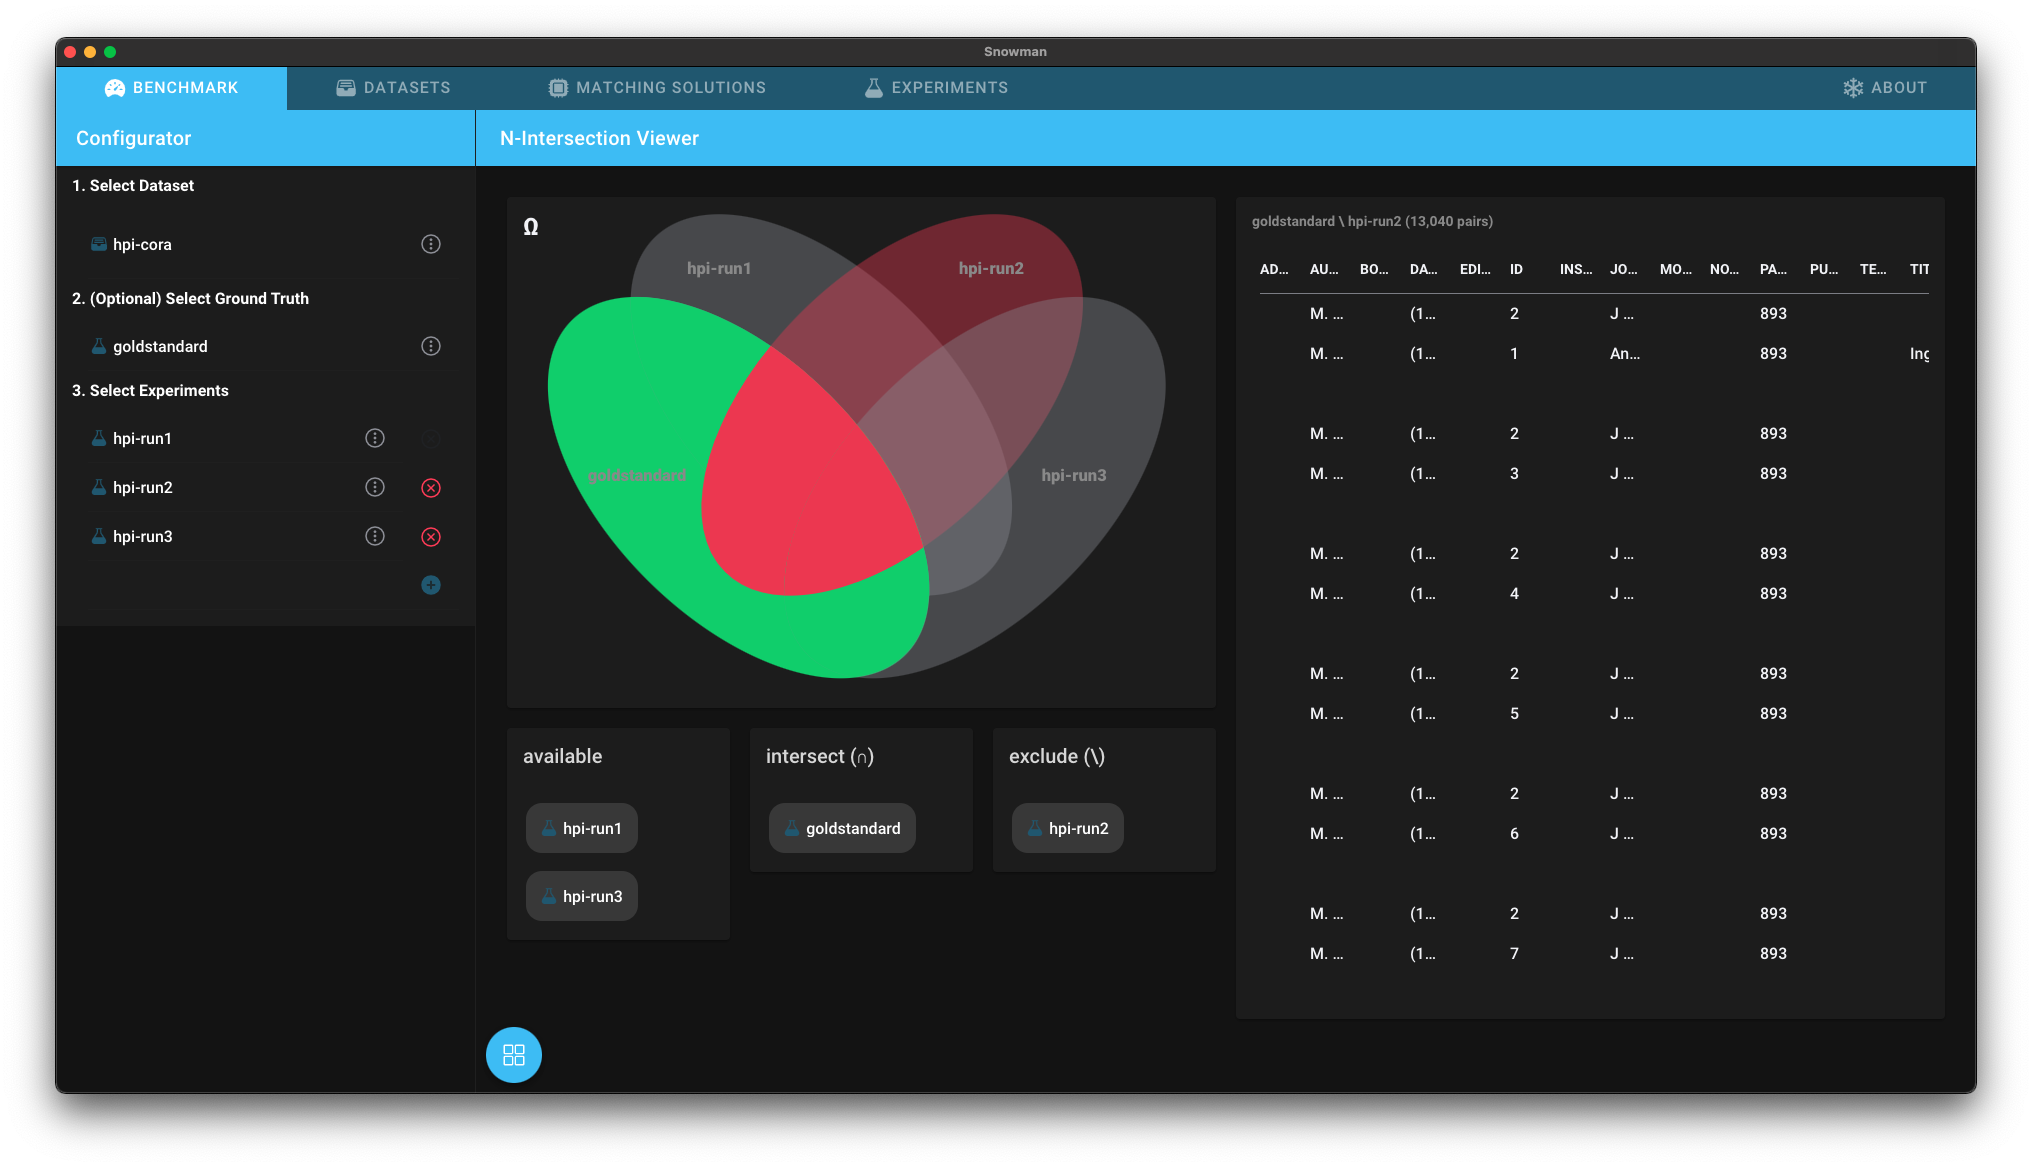
| N-Intersection Viewer |
The N-Intersection Viewer allows you to investigate which duplicates have (not) been detected by which matching solution. |
 |
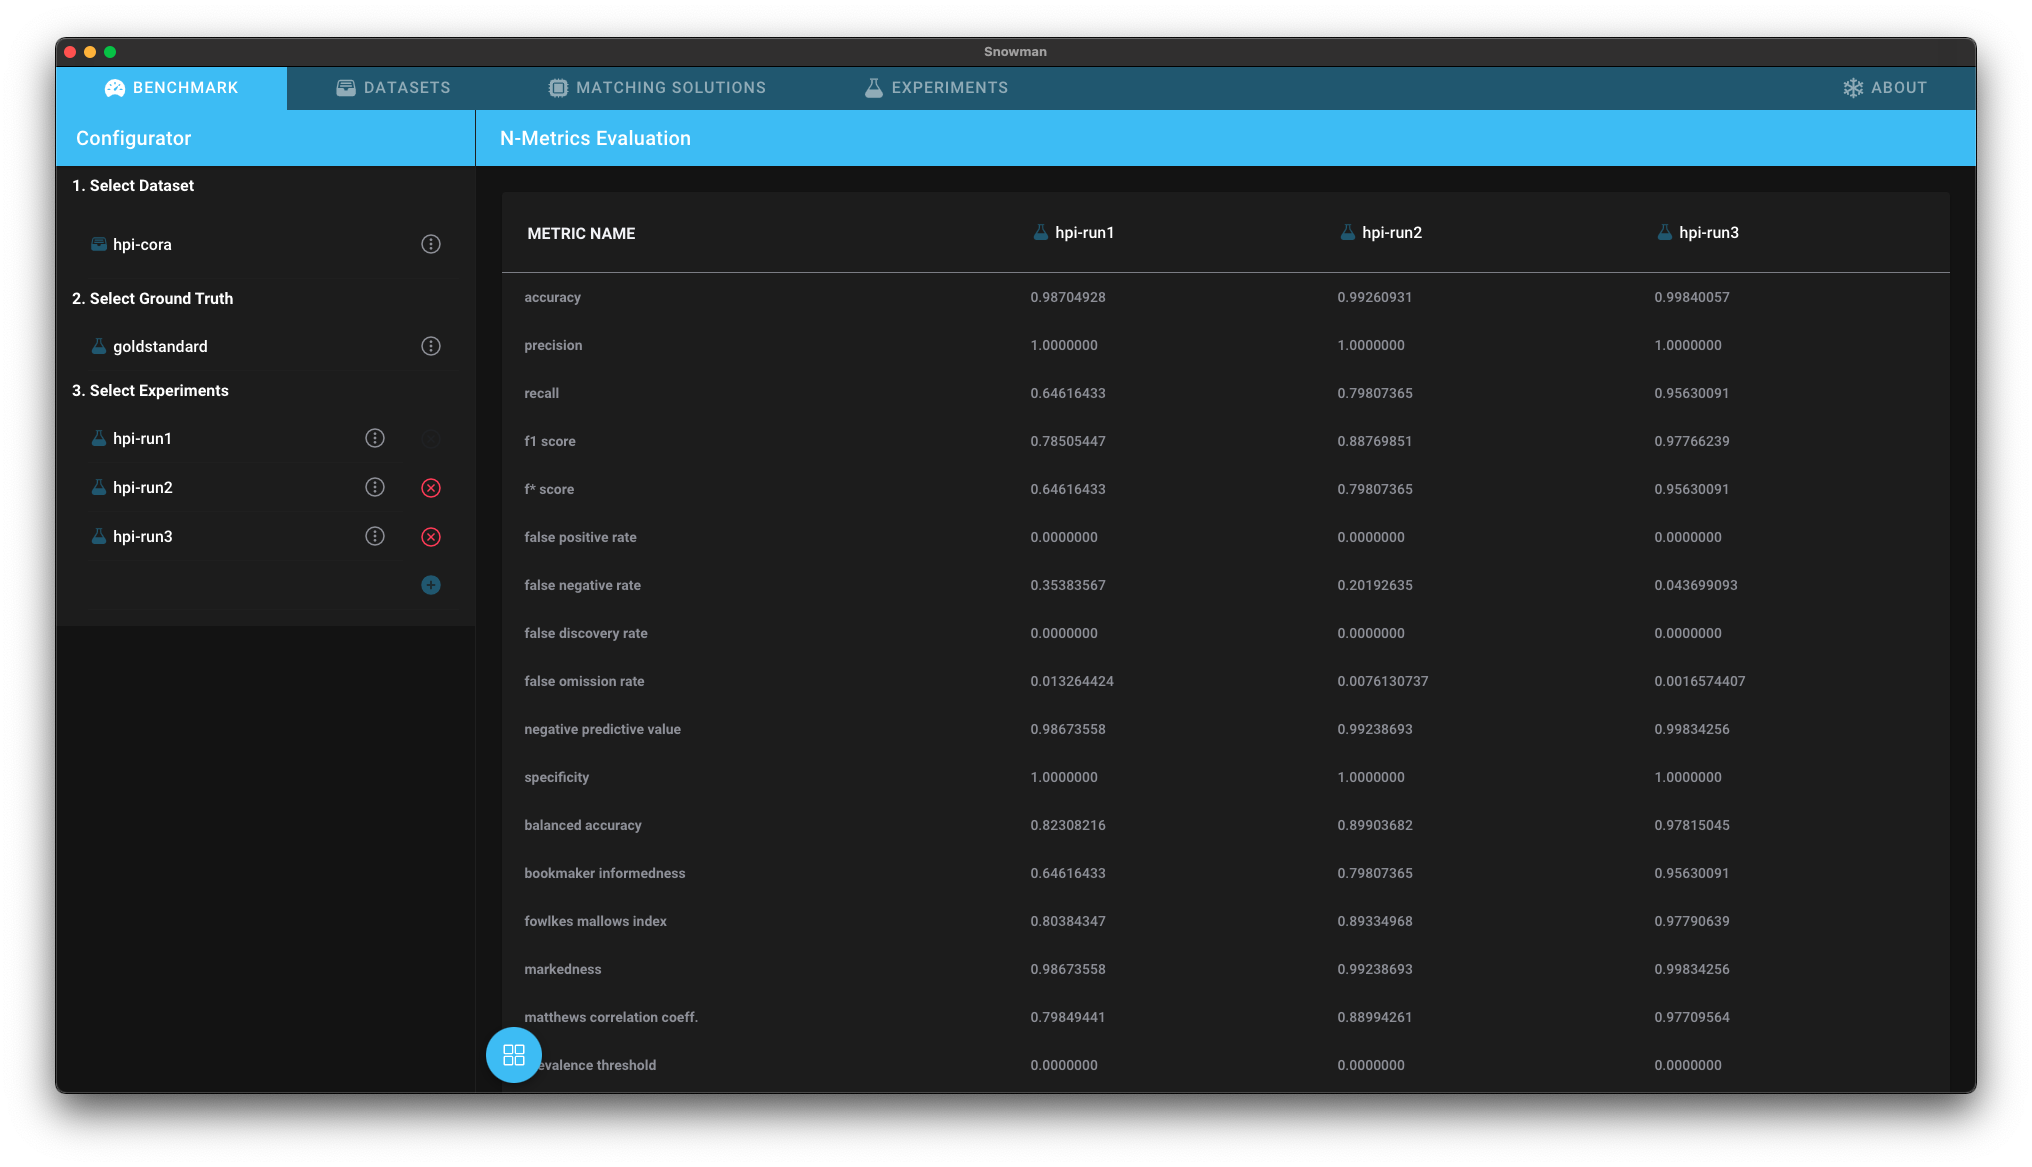
| N-Metrics Table |
The N-Metrics Table allows you to compare performance metrics of multiple experiments. |
 |
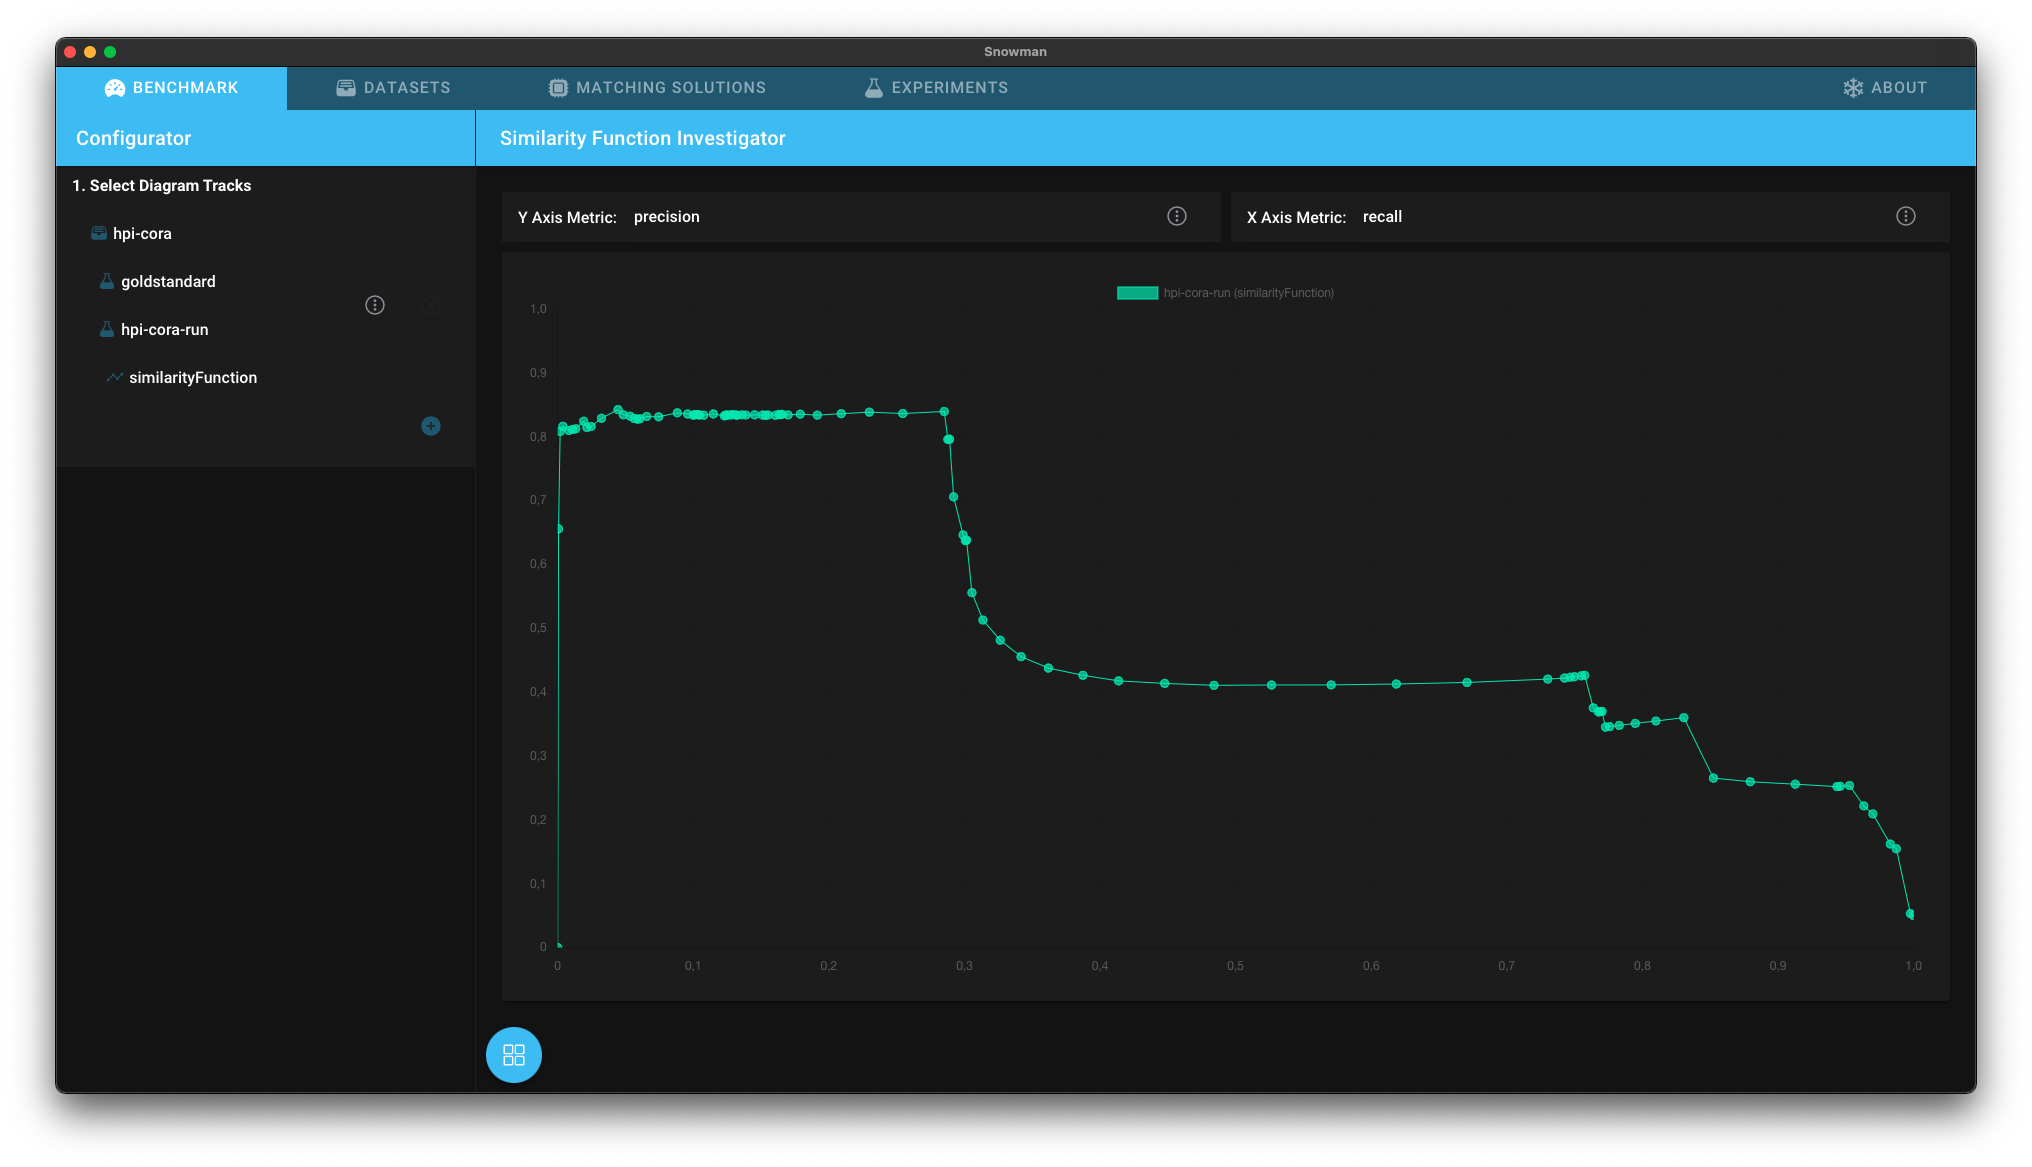
| Similarity Diagrams |
The Similarity Diagrams analysis allows you to find the best similarity threshold. |
 |