Binary Metrics View
Info
Requires a gold standard.
The Binary Metrics View allows you to explore how good an experiment performed by showing it's predictions and performance metrics.
Getting Started
- Add the benchmark dataset to Snowman
- Add a gold standard for the dataset to Snowman
- Add the experiment you want to investigate to Snowman
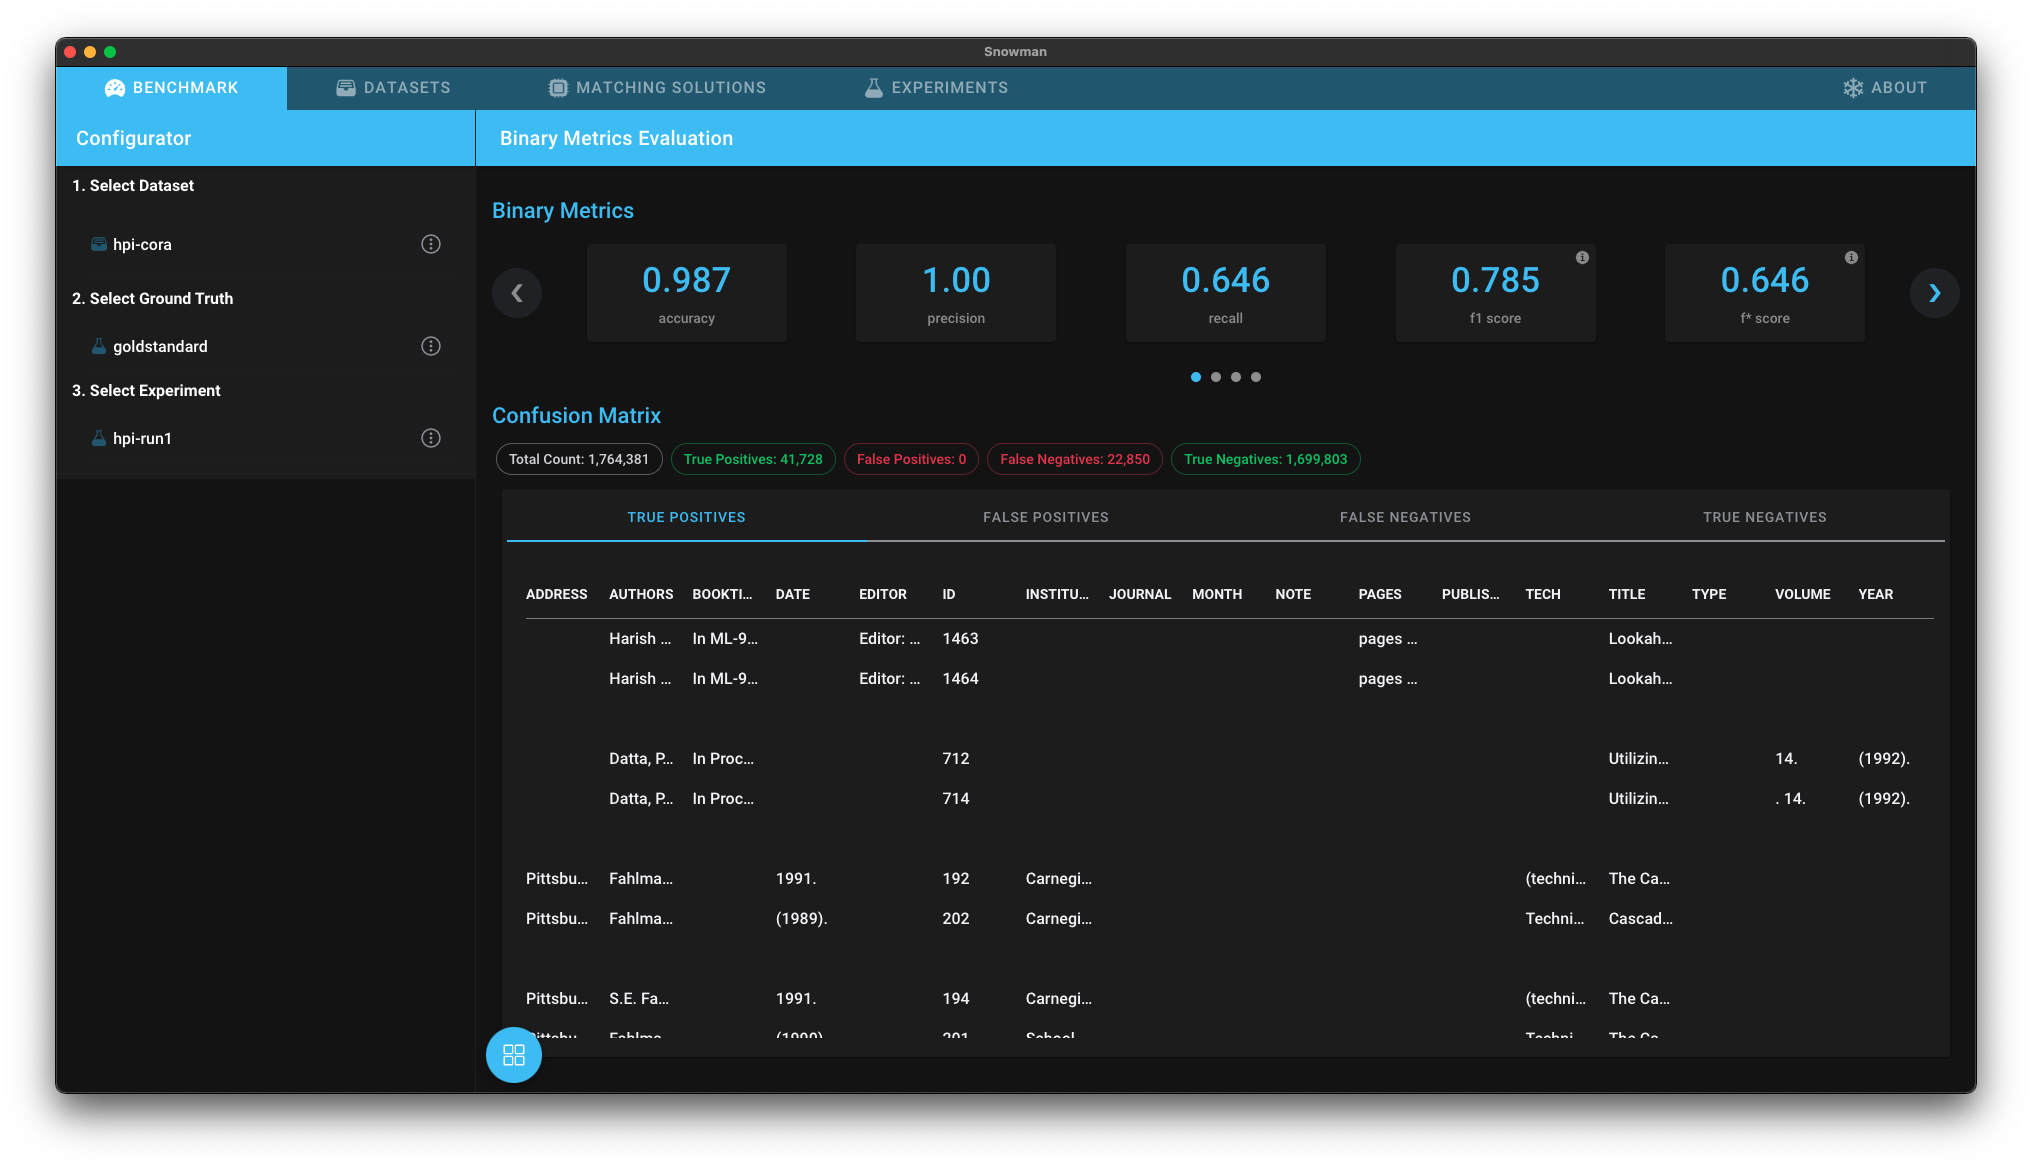
- Open the Benchmark Dashboard and select the analysis Binary Metrics View.
- Select the dataset, the gold standard and your experiment in the configurator
Interpreting the Results
Metrics are calculated and shown in the top carousel. You can step through all the available metric cards and get an overview over the quality of the experiment. Keep in mind that these metrics are only as reliable as the gold standard is! Some metrics may be unreliable when calculated with a silver standard. In the future our tool will highlight such metrics (see this issue).
Also, you are able to inspect the true positives, false positives, false negatives and true negatives in the table below.